September 2013 archive

Some thinking about information visualization and representations.

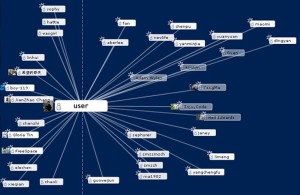
  In this day and age, developed in the media and information explosion, there are large amounts of information in our living. Here comes a question as for how to find information that needs it most in an instant? As an interface designer, this is a common problem. Data visualization It is a splendid way …

Continue reading

Week 2- Representations

Escaping Flatland/Things That Make Us Smart The need for data visualization has existed long before any concept of a graphical user interface and it is now more important than ever to be able to master the skill of conveying information in its most clear and useful form.  In my past experience in research biology, figures …

Continue reading

Reading Response: Week Two: 3-2 2-3

I’ve always been a Tufte fan, and what fascinates me the most about his work is his explanations and suggestions/revisions for theoretical apparatus (often classic) in an extremely practical way, and his examples of pictures and descriptions are always nested in each other perfectly, or as I call it: “purposefully visual”. Good visuals have a …

Continue reading

Information Representation in User Interface #reading response 2#

I want to talk about flat design when we talk about a word such as ‘ Flatland” and “information representation”, the same as the passage” Escaping Flatland”said, we display information in a two-dimension world.  The whole passage is talking about flatland as a way of information displaying. And in the field of design , recently …

Continue reading

Information Representation

I did a freelance job once where the client gave me pretty much free reign. He told me to make an informational flyer for airport vendors and threw in some copy. I’m quite enthralled with the infographic trend so I designed this how-to sheet in the infographic style. I was pretty pleased with myself as …

Continue reading

Reading Response week 2-class 1

Escaping flatland From this article, I learned that a good information design must have three elements: high quality maps which combine substance, statistics and design; diverse details which enable readers to understand the main idea in shortest time; several layers of close reading combined with an overview data from engineering surveys. Otherwise, the whole data …

Continue reading