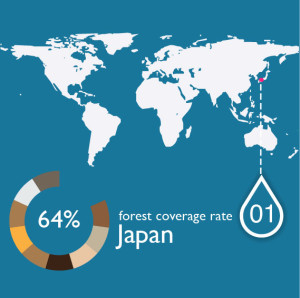
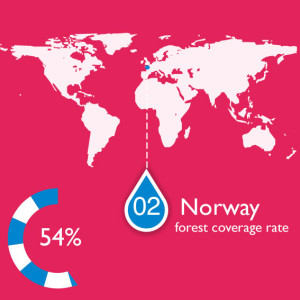
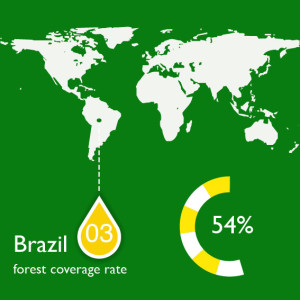
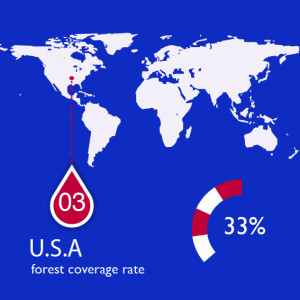
In sixth day of 7 in 7 , I tried to do something I never done before.
And I’m used to interested in how can information present in a more visible and helps people to understand information in a more effective way and how to deliver information in an accurate way.
I choose to present the forest coverage rate of four countries to arouse people’s attention on about the nature resource. The global forest coverage rate in fact is keep reducing every year , the majority reason is because the human being activities.I did this four picture as a storyboard for a video. In order to accomplish a data visualization to deliver information, in fact after we select topic, a data visualization is not as simple as I imagine. Every data visualization project need in-depth survey. Like in this project , I need more time and resource to find an accurate data and detail behind data to present them in a good way. However I still think this is a good way to explore the designing method.


Comments