My inspirations of this project is from my own life, I have been in a interracial relationship for two years, I found although there are more interracial couples in US than before, people still know a very little about interracial couples around their life.
My digital-digital mashup is a data representation video about interracial marriage in the US
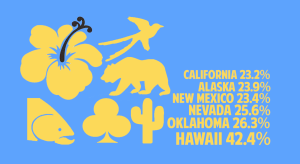
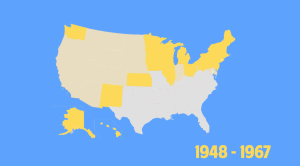
In this video, I made a short over view of the history of legalized interracial relationship in United States and used graphics and charts to convey the statistics data by location, gender and race. Which district has more percentage of interracial marriage, where has largest number of interracial couple, which race is more likely to chose interracial marriage and other comparisons to let people know more about interracial relationships.
My video link:
Here is some interesting data fro my video:
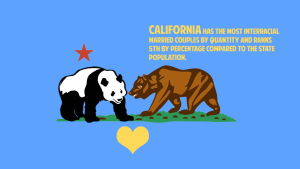
1.The more wealthy the states is, the more more interracial couples it has. The top ten states have highest number of interracial couples and have more than 60% of national GDP.
- The differences of race preference who choose their partner in interracial marriage between male and female can vary dramatically. 47% of white husbands who are in interracial marriage have an asian wife. But for white wife, only 20% chose an asian husband.
- Nearly 90% of asian wife who are in interracial marriage chose white husband, which makes the highest race preference in different genders and races.
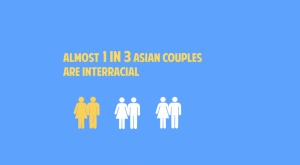
- Asian has highest percentage of interracial couples, which almost one in three Asian couples are interracial.


Comments