Facebook Redesign prototype

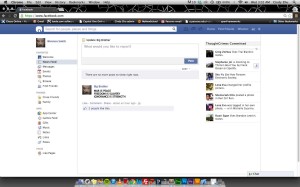
I wanted to redesign facebook by adding mood condition with postings.

When we share our thoughts and mood, music and visual effect are the great way to represent our mind. Especially because facebook is the global social network, sometimes it is hard to understand other countries’ language and their cultural expression. However, music and visual effect are the way to communicate to others  with less limits even though we don’t understand its lyrics. Therefore, I came out of the idea that can express our mood condition and our feelings in a dynamic way to share with others. In other words, it means facebook will be able to possess not only community and video but also music market.

Screen Shot 2013-09-04 at 10.19.34 AM Screen Shot 2013-09-04 at 10.36.07 AM

Reading response week 2

Music, drama, photos, movies, novels, experiences, these are ways to spread information nowadays. More and more novels are turned to movies, because people prefer to watch movies as entertainment, visually pictures and sound easier to be accept, people feel relax when watching movies.


As the development of technology, we’d like to use the word ‘experience’ to describe how we obtain information. In Universal Studio, when audience watching ‘the Simpsons’, the movie not just includes visual and sound, it added the real experience, like when we watching the Simpson sneezing in the screen, we could really feel water sprayed to our body from the seat in front of us, it feels like the virtual world in the screen, turns to reality, it brings us into that virtual world, audience are parts of this show. In this way to express information, could let us have fun, and feel directly about this information, without thinking, we could get it. So, things really make us smarter? Or make us thinking less and turn stupid?


Apple’s computer operating system, let us feel easy to use, that’s the main reason that why people prefer to use Apple’s operating system rather than Windows 7. Actually Windows operating system could achieve the same function as Apple’s, but people would choose the product more easy to use, the expression is different, that’s the key.


What is a good design, a version is ‘good design don’t need instructions’, no more explanation, people will automatically understand. That’s means things make us smarter? Maybe designers are smarter, to find a way to let people thinking less, and turn to less smart.

Reading Response : Week 2

Nowadays, we are living in a flood of information since the Internet invented which means we are in a era of information-rich. Numurous information mixed in the Internet that has affected greatly to our life pattern. While we went to library to search information that we need in the past, we now turn on our computer and google it to search the information. Even though we can get information easier and faster and even greater amount of it, I feel more complex to find exact information that I need.

When I google something I feel there is too many words that I suppose to read to check the information would be needed or not. Information that we have is dramatically keep increasing, but the lack of information representation makes me hard to find which information I need.

However, it can’t be organised and represented in a same way to all of the information in the Internet. The reading, “Things that make us smart”, says “that no single format can ever be correct for all purposes.”. I totally agree with the statement, and I want to consider who, when, why, and which purpose people use the Internet. The very usage of the Internet is to achieve information on the Internet which can be an important statistics for analysing things, or a personal questions for asking simple cooking recipes, or finding just funny stories that make you laugh. People have been using same information tool to get an information in different needs. I want to consider how information can be more representative that can be easily understood with  a variety of needs.

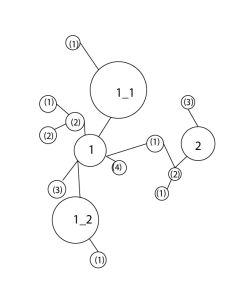
For example, not just words displayed on the screen, we can provide visual representation to give clues of information where it came from or how the information comes from or which references are included in the information by colour and hierarchy structure visualisation. From the representation of relation of related information, we can follow up related information more accessibly.Screen Shot 2013-09-04 at 9.13.08 AM


Like above rough image when we get the representation of relation between information, we can get into 1 information that we think it is necessary information and we need some more of related information, we can choose 1_1 which is bigger than 1_2 (size can be shown as extent of relation) and if we found that 1_1 is not the information I want, we can change the path we were in to the 1_2, the new path. After we find 1_2 is a good information, we can go forward to 1_2’s (1).


It will be easy to understand where I am in now on the Internet world that can help you to surf information sea in a proper path.

Week 2 Day 1 Reading Response

Week Two: Day One Reading Assignment   This weeks readings, “Escaping Flatland” and  “Things That Make Us Smart: Chapter Three – The Power of Representation” both provide an excellent critique on both exemplary and poorly crafted methods of conveying information. While both articles give examples and context for the preferred methods of conveying information visually, I believe that they have some minor contradictory aspects.  “Escaping Flatland” begins with giving the reader inspiration for making information not only more palatable for the target audience, but making it more functionally useful by creating more dynamic, engaging visualizations. Flatland as a concept represents metaphorically, and sometimes even literal, two-dimensional expression of information. When media (both paper and electronic) is presented in a fashion that does not take advantage of multi-dimensional expression It removes an element of relation to the audience. As a side note, one thing that struck me about the Flatland based article was an arbitrary comment about Aristotle and religion. According to the article a major impedance upon the design of mapping Sun Spots was the idea that Aristotle perpetuated that celestial bodies are works of perfection with no blemish. This issue has always been a very interesting subject to me, not necessarily in the context of these two articles, but in social design. How easily innovation and creativity can be stifled by social or emotional information. At the same time, chapter three of, “Things That Make Us smart” approaches the problem of information conveyance from a more technical and almost methodical approach. In the example of the question of 15 versus the game of Tic Tac Toe, we see dramatic extremes of how we rationalize and internalize information. When shown overlapping the game structure of Tic Tac Toe, the logic behind the game of mathematically reaching 15 through a 9 digit 3 by 3 matrix it takes on an almost Sudoku like dispersal of information. I believe that where these two articles differ is in the fact that the “Smart” chapter perpetuates the idea (via the example of airline scheduling visualization) that the least user friendly visualization actually is the best design solution for the airport because of the need to convey as much information as possible. While acknowledging the other methods which would convey more important information to passengers, it provides a more direct link to the problem solving process, most directly which problem is more important to solve.

Facebook Redesign

ourbook: A Social Network for a Totalitarian Regime

In 1984, George Orwell depicts a dystopian society called Oceania where communication technologies are used as mass surveillance to ensure the dominance of the state.  The proletariat masses are kept at bay through constant monitoring of actions, speech, and even ideas.  Those who commit “thoughtcrimes” against the Party are forcibly rid of unwanted thoughts.

Many of the technologies that Orwell wrote of in the late 1940s are staples in our daily lives now.  The ‘telescreens’ that monitor the every move and sound of 1984‘s characters are easily reflected in our television screens, our ever present smartphones, webcams, and GPS systems.  Orwell undoubtedly predicted the evolution of communication technologies, though whether he correctly saw their implementation is still up to debate.  Numerous opinions believe we are headed toward an Orwellian present, especially with recent insights on the NSA and wiretapping of civilian information.

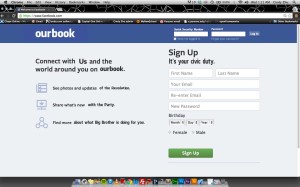
The aim of this project is not to debate whether or not 1984 is indeed upon us, but to imagine how the characters of this world would use our modern day social networks.  The masses of Oceania are given roles within their society that feign the structure of a free thinking civilization.  A social network provided by the Party would add a digital level of complacency. ourbook serves as a way the average citizen can communicate with Big Brother, mainly through addressing the misdeeds of others.  This self-policing tactic makes the user feel important in the eyes of the Party and a responsible member of society.  The Party in return will feed back (only positive, and likely fake) news of the ongoing Revolution to conquer the other land masses.  A thoughtcrime reporter will also show live feed of crimes being committed in the area,  making users less likely to commit a crime for fear of shame and judgment.  This false sense of civic participation makes the people feel actively engaged in their government.

ourbooklogin


ourbookhome


The above shows that while ourbook may look like a typical social media site, there is nothing quite social about it.  The individual is not the important factor here, rather it is the interaction with Big Brother.  Individual pictures are shown only in the ThoughtCrime Committed News ticker so citizens will know who to punish for their transgressions.  The main text input in the Home Page communicates directly with the Party and Party messages are the top priority in the newsfeed.

Week 2 Reading Response- Information Representations

In the reading -Things Make Us Smart (chapter 3 The power of representations), the author Donald A Norman indicated several very impressive examples to explain how information representations become a useful tool as an artificially constructed artifact. By using the the example of the draft of PhD dissertation explains how information representations help people gain a better understanding of an abstract concept. Information representations can also provide and simplify relationships (from the example of two games) or useful data in complex systems (from the example of the comparison of flight duration times between three air companies). On the other side, information representations can help people organize information in a more effective and lucid way (the example of medical descriptions).

In my reading response, I want to use my own experience to support the reading’s points about the usefulness and effectiveness of information representations and add my own understanding and perspective about information representation.

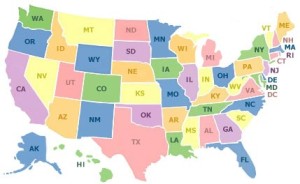
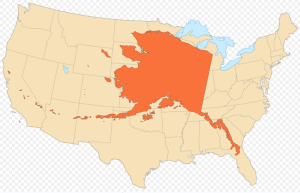
Firstly, I think information representation can also change people’s perspective to observe things and even mislead by providing inaccurate information. For example, when I ask people which is the largest state in Unites States, a lot people think it is California or Texas, and only few people think it is Alaska. This is because the map of USA that we see most commonly (the frist map at below) intentionally makes a different scale for Alaska much more smaller proportion compare the mainland due to the limited space to show the whole nation in the map. But the if we want to make people to have sense of how big the Alaska is, we can show them the map right below with the actual proportion of Alaska with US mainland when they are overlapped (the second map at below). In conclusion, information representation can help people in various ways to obtain information and also represent the principal purpose to the viewer from the information provider.
usa-map2Screen Shot 2013-09-03 at 8.11.39 PM


Secondly, in pages 5-6, the author shows how graphical charts monitor the flight’s duration time between different air companies and how that can help people directly figure out the flight duration time without complicated arithmetic. In this case, I agree with the points of author, but I think he can chose a better example to prove this case. The author shouldn’t use air flight duration time because it is not the most essential information for international travelers. These travelers care more about the arrival time and the condition of air company service. Even in the graphical chart, we still can see the difference of duration time is relatively small.

I would use the comparison of the commute times between different subway lines of the NYC MTA system as an example. People usually associate the commute time with geographic distance between two places and these distances are shown in MTA map quite clearly; But NYC subway offers both local and express trains, and so the distance maybe not reflect the length of your commute time. For example, I live in Washington Heights, Manhattan, and it only takes me 20 minutes to cross over 150 blocks to get to lower Manhattan by taking the A express train, but if I take local C train, the commute time can be over one hour with same distance. If we use visual information representation to show the the length of commute time which is daily commuters and tourist care about the most will prove the authors point that information representation can help us get useful data in complex systems.

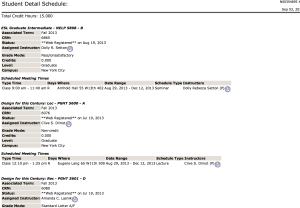
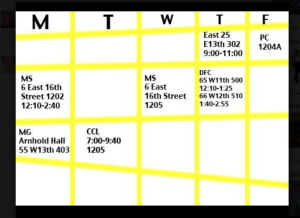
At the end, I found another example to prove the author’s point about how help people to organize information in a more effective and clear way. My class schedule in my NewSchool account contains all the information about the class I have this semester, but the sample vertical layout to present the informations that contain different locations and times during a whole week can be very overwhelming to check everyday.
Screen Shot 2013-09-03 at 11.11.22 PM

Organizing all the information in a standard format by time can help me dramatically understand and develop a sense of my class schedule during one week. I can clearly see I have three classes in the noon and so I will have a better idea when I should prepare for my next class.
Screen Shot 2013-09-03 at 11.07.15 PM


FBVoice

Here I have included a stop-motion paper prototype for my Facebook re-design: FBVoice. (The video displays the desktop, not mobile, view)

As I mentioned last week in class, FBVoice aims to break down the barrier of miscommunication and uncertainty when it comes to Facebook statuses and comments. With FBVoice you can upload video or audio statuses and comments, but the user is not obligated to view it solely in that format. The default page that any user will see is just text. It isn’t until the user clicks on the text that the sound or video will play. With FBVoice it will be much easier to have a more natural conversation on Facebook and it will clear up any uncertainties of mood, tone, facial/gestural expressions of the person you are communicating with.

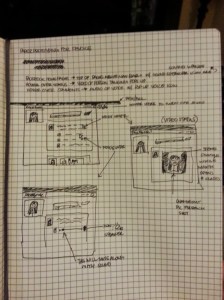
Through guidance from our readings on prototypes I was able to put together a quick mock-up (which I showed in class last week- here it is again), and I also did some pen and paper mockups so I could convey my idea exactly without working with the visual constraints of the actual Facebook site that I worked with on my first version. These drawings can be seen below.

FBVoice Mockup

Redacted: An Experiment in Privacy Education

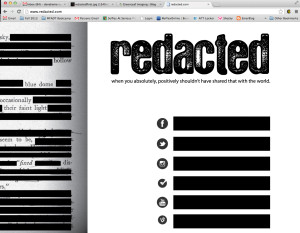
For my Facebook Redesign Project, I’ve prepared a mock up of Redacted: when you absolutely, positively shouldn’t have shared that with the world. 

redacted

The idea is that in this culture of oversharing, we don’t take the necessary moments of reflection required to make informed decisions regarding whether that post is actually suitable for public consumption. Redacted is a generator (like the fabulous Geocities-izer) where you select a social medium, enter your username, and based on text and hashtags, you are presented with a momentarily redacted version of your profile.

Redacted is designed to make the user question presumptive sharing. It is visual privacy education.

*This project makes liberal use of brand-new, completely-shaky, exposed-to-just-one-class-so-far After Effects education.

**”Yolo” by Lonely Island just felt appropriate for the subject matter.

Facebook Redesign idea

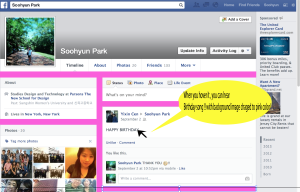
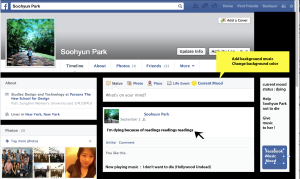
My idea for Facebook redesign is that adding background music, color, images that reflect one’s mood. Current Facebook is standard format for every one and they just allow us to adjust profile pictures and cover photos. I want to make Facebook more dynamically represent one’s feeling and show one’s idea in an active way. At the first draft idea, I want to design personal Facebook page to redesign Facebook in user-centered design, but the idea was too way out of the original concept of Facebook which is for sharing information and our ideas. Therefore, I want to keep the original concept and format of Facebook, but put ideas providing personal ideas that represent them dynamically.

In specific, people can design their own page with their own background and music. It will appear when other people hover their profile picture. Additionally, people set background images and colours and also background musics which are related to their postings and their mood. As a result, when others hover their posts, the background color will change and also background music will start to play. This can represent people’s comments more dynamic and people can feel one’s mood better.

This change that shows people’s mood and feelings of each posting will bring more effects of representing various emotions in a limited space, web page.

Some thinking about information visualization and representations.


In this day and age, developed in the media and information explosion, there are large amounts of information in our living. Here comes a question as for how to find information that needs it most in an instant? As an interface designer, this is a common problem.

Data visualization

It is a splendid way to show the information. I firmly think about that if we use the different way to show the same information, a result is produced that is different. This is their power. However, when I finished the reading, I have a question—that is, whether art or Science? Maybe it is between the art and science.

Data visualization is very interesting, it through a series of technical methods to transform boring data into colorful graphs and charts. It greatly enhances the readability of data by visual presentation.


Information visualization

About information visualization, is high lever than data visualization, and it is transformed from data visualization. Personally, I think of that we can increase large mount information and some kinds of design to unite into one design, and through a series of design methods to improve the visualization become better.

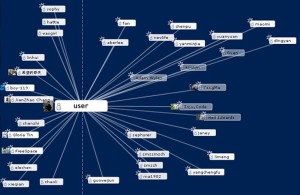
Because I think the information visualization not only can show some boring data, but also can display in Social network, just like this image.

未标题-1